In early 2022, Firmatek acquired our first methane detection sensor. After a long R&D process and demonstrations of many available sensors, we decided the Pergam Falcon laser-based sensor was our best option. Typically, there are two different methods of measuring methane concentrations with UAVs. A laser-based sensor (TDLAS – Tunable Diode Laser Absorption Spectroscopy) that measures the absorption of CH4 in the air column between the sensor and the ground, and a “sniffer” method which determines the concentration of methane in a sample of the air at or near ground level. Both are accurate means of measurements, but the process of capturing data differs significantly.
With a “sniffer” sensor, the unit drags a tube on or very close to the ground and sucks air in as it flies a mission. With this method, the end result is getting a traditional methane concentration measurement wherever the mission was planned to fly, at a sampling rate of x number of measurements per y time. Contrarily, the laser-based sensors fly a grid pattern 20 meters off the ground and uses TDLAS. As the UAV is flying the grid pattern, it records measurements every second which later are averaged to readings of every 1.5 – 2 meters (Figure 3). The sensor has a specifically calibrated wavelength to measure the absorption of CH4 in the air column. For example: when the laser returns, if 80% of the beam returns, then there is 20% of methane in the targeted air column. With this information, we can determine the PPM x meters of concentration in the air column (Figure 1).
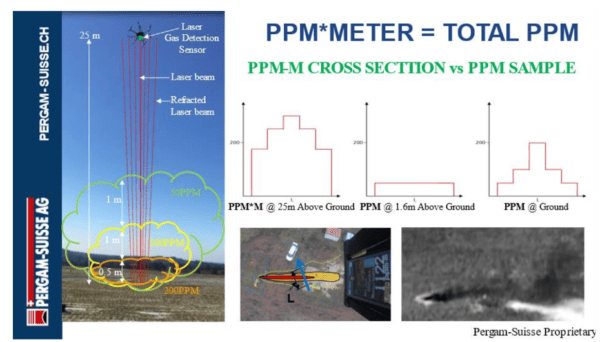
Figure 1. Pergam-Suisse
There are several challenges associated with using a UAV-based sensor. The first and most important factor is the safety aspect. Both methods present safety concerns due to the UAV flying at low altitudes. However, with a sniffer sensor, there are quite a few more hurdles to completing a flight safely. Due to dragging a hose on the ground, there is a high risk of the unit snagging something on the ground. Also, if the area is active with changing elevation, it is difficult to maintain the correct altitude throughout the mission without collecting and loading in a digital terrain model before the flight. It is very difficult to maintain RTK corrections when flying at this low of an altitude. Additionally, sniffer drones cover less ground relative to the lidar drones, which presents logistical challenges that include battery management, project completion time, and dataset inconsistencies due to larger timeframe windows. Methane detection data is ideally collected in the shortest possible window, so results aren’t dominated by environmental factors.
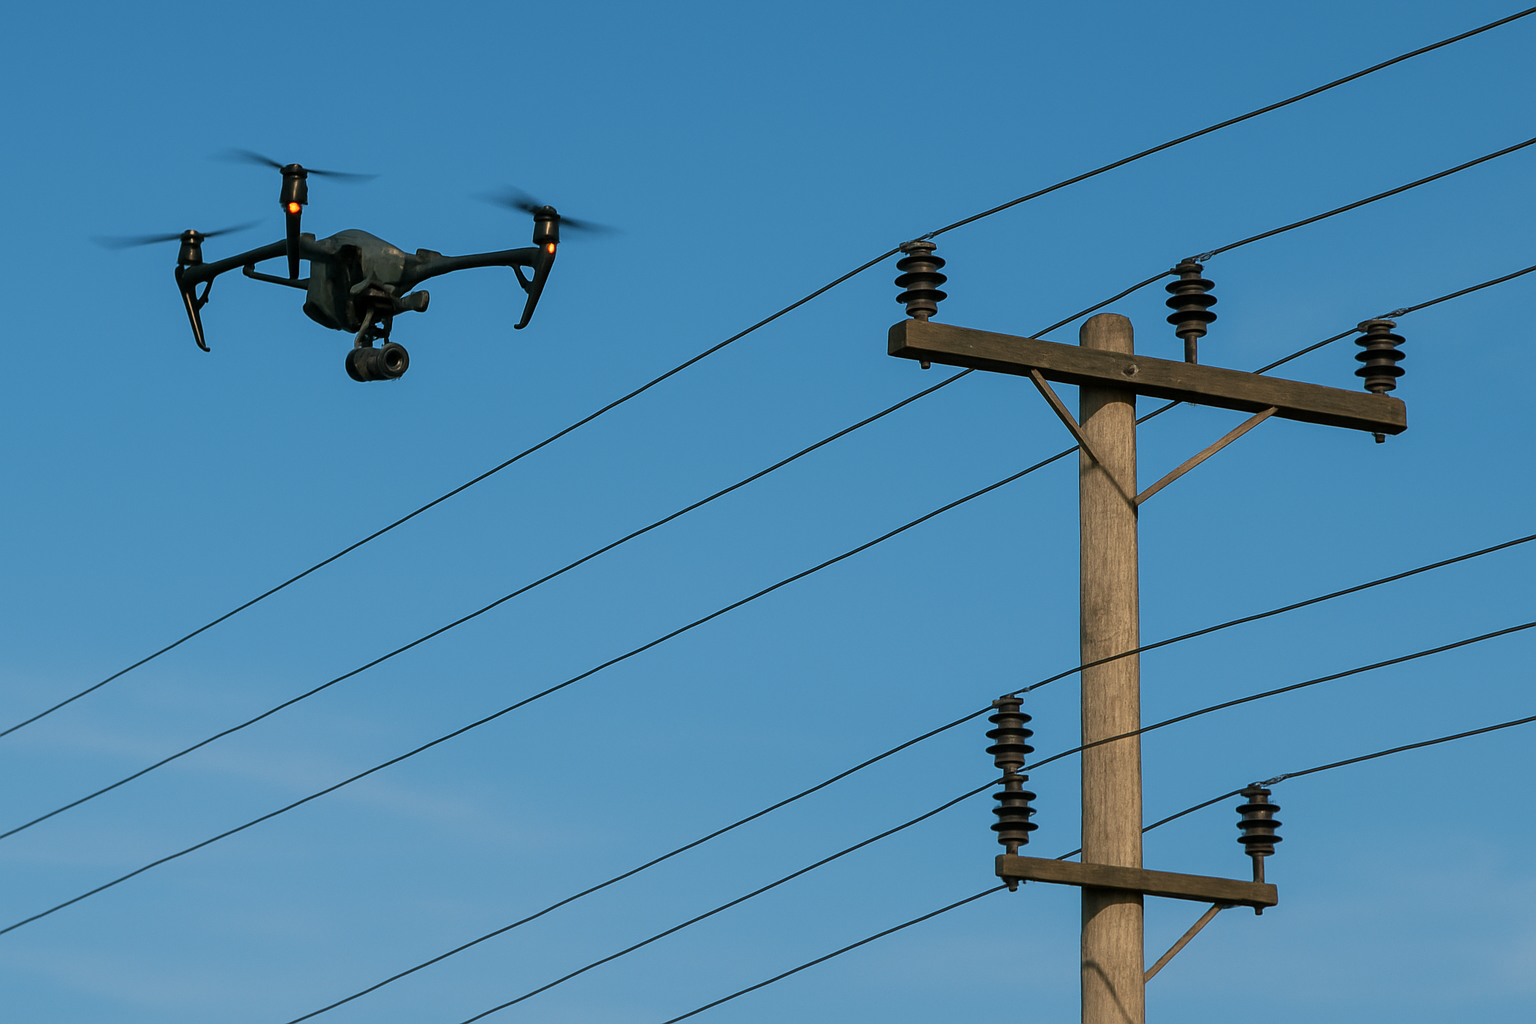
A laser-based sensor also has some concerns. Similar to the sniffer method, pilots must exhibit caution when planning flights as to avoid collisions with electric utility infrastructure, flares, buildings, and other structural hazards. However, considering there is no contact with the ground, these risks are reduced. Risk of UAV collision is further reduced by using a laser altimeter, rather than a historical digital terrain model, to maintain a constant height above the ground. With a single beam system, you are limited to about 300-400 acres per day.
Both systems are limited to detecting leaks and general distribution of methane across a site, and should not be used for total output calculations. Although our methodology collects data at a higher resolution relative to other technologies, the ability to model total output calculations requires an even higher resolution that is currently not possible as this scale. Instead, the results of the data are used to identify areas of concern and assist in mitigation in the targeted areas of concern. Additionally, another useful application of our methane detection services is along pipeline right of ways to detect leaks.
Similar to our topographic survey deliverables, the data collected using the methane sensor is georeferenced and can be integrated into any GIS system (Figure 2). We can produce hot-spot maps showing areas of high concentration using inverse distance weighted interpolation, and overlay existing gas system networks from existing CAD files if available. These maps also display environmental conditions that may have affected the data, however, the benefit of using UAV-based methane detection systems vs. airborne (planes) is that the sensor is far closer to the source, therefore less impacted by wind speeds.
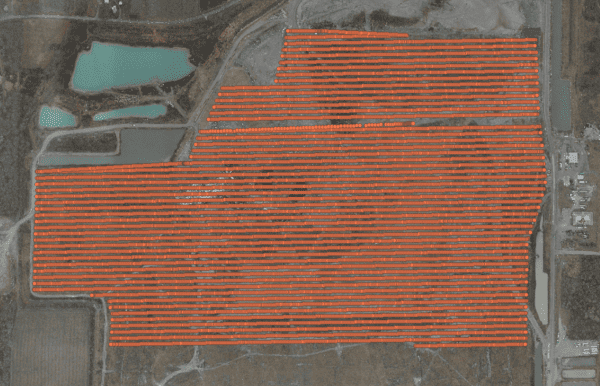
Figure 2. Post-processed data for a methane flight covering 180 acres.
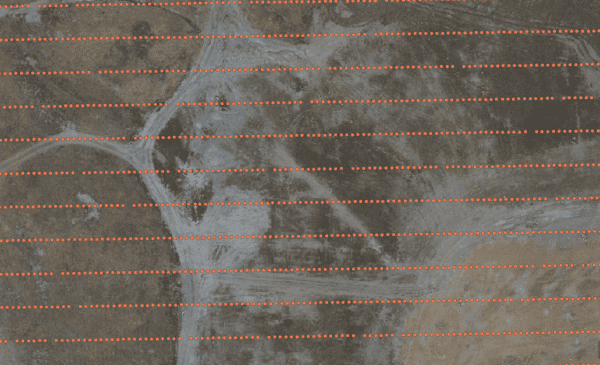
Figure 3. Example of sample spacing for post-processed data. Flight lines were ~15m wide, with a sample collected every ~1.5m.
Wind direction and speed are an important variable to consider when analyzing the processed data. We collect weather data and display them in a wind rose diagram. The wind vector data is important to consider so methane plumes are not “double counted”. If weather data isn’t logged, a mission may appear to have a plume across the entire site, but in actuality it is coming from one source.
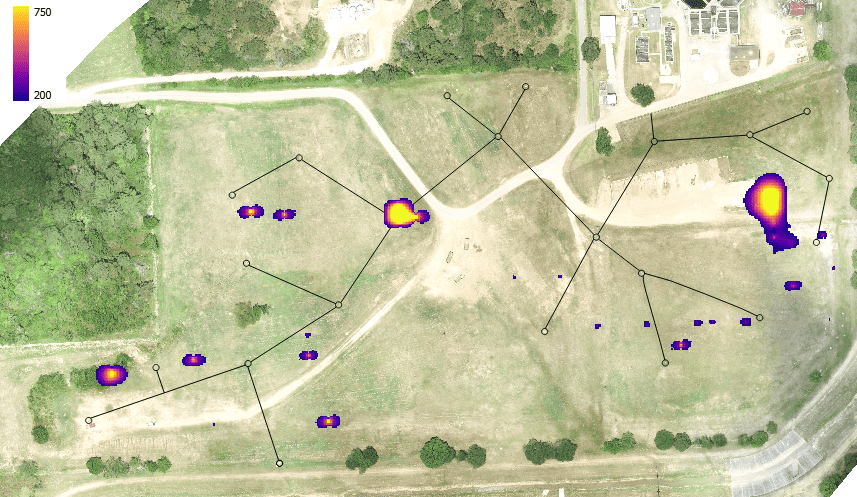
Below is an example of our methane detection heat maps. This is not thermal data, instead it’s showing methane clusters. Additionally, we are able to overlay this data on top of existing gas collection and control systems CAD. This can show wells that are leaking methane. This map will help site operators identify and mitigate any methane leaks across the site.
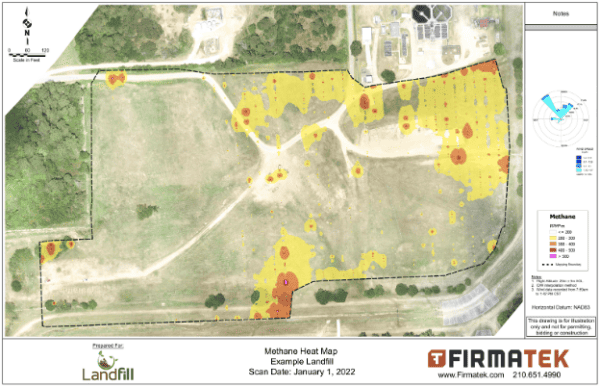
Figure 4. Example of Firmatek Methane Detection Heat Map.
UAV methane detection is revolutionizing environmental monitoring by providing a cost-effective, efficient, and high-resolution solution for detecting methane emissions. As this technology continues to advance, we can expect significant contributions from UAV’s in identifying methane sources, guiding mitigation efforts, and ultimately reducing the environmental impact of this greenhouse gas.
Contact our team today if you would like to learn more about methane detection and concentration mapping.