By Seaver Hall, Project Engineer
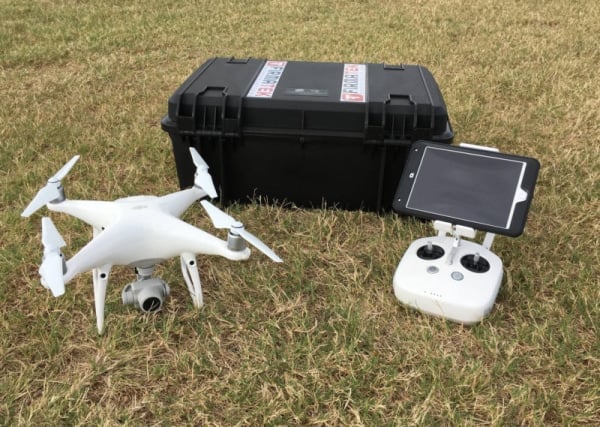
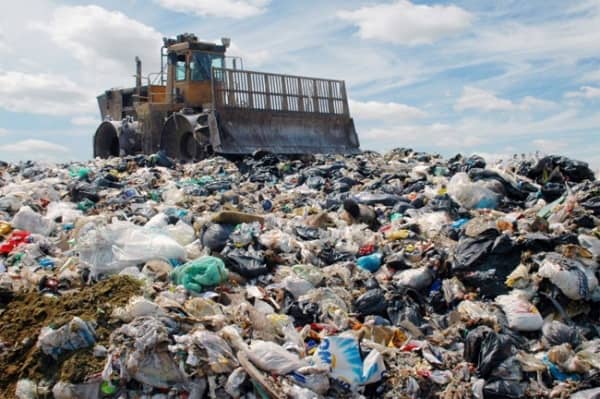
Firmatek has been a trusted service provider in the 3D mapping industry for several decades and strives to continually find new applications for technology. We provide topographical mapping solutions using LiDAR and RTK drone based-photogrammetry for the solid waste industry. This means we can produce an ortho-rectified photo from the day of the survey and also provide maps that are vital for operations. Due to COVID-19 and working from home, we know our communities are producing more trash. With this in mind, tracking remaining constructed airspace is more important than ever.
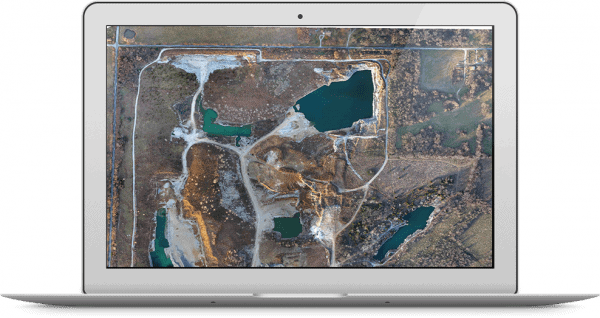
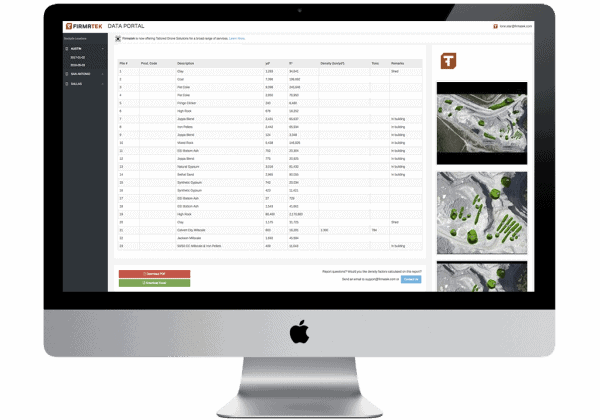
As part of our service offering for the waste management industry, Firmatek provides fill compaction densities, remaining airspace, and remaining fill isopach maps. These color coded isopach maps show the exact remaining fill across the entire active cell. Examples of this map are below.
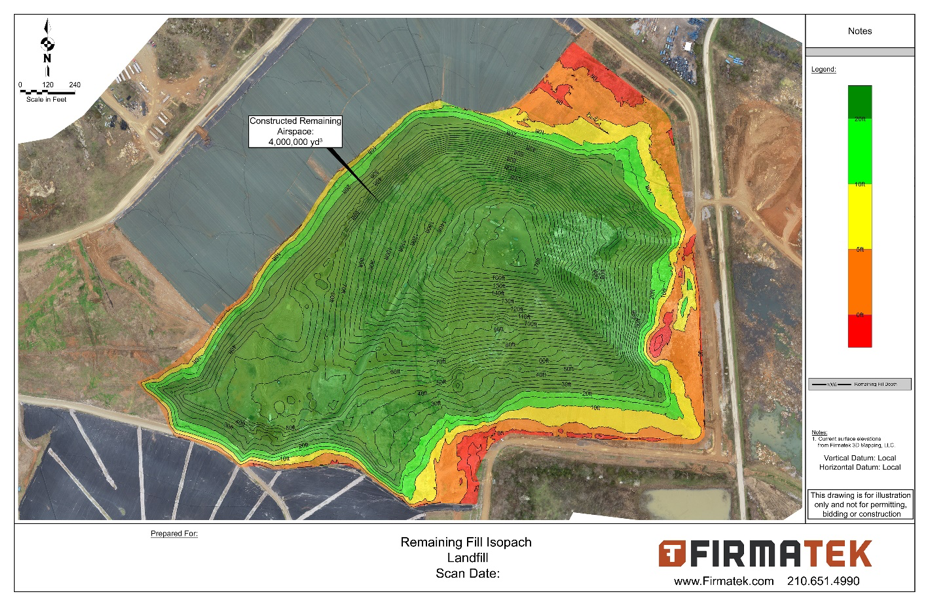
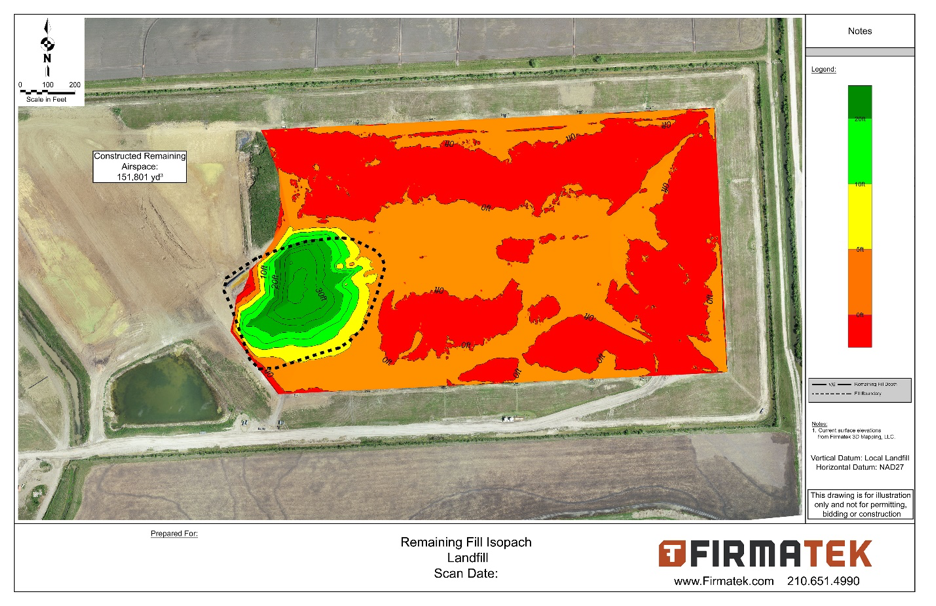
These maps help the operations team by showing the depth of areas that remain to be filled and exactly where that permitted airspace is, which aides in deciding the most optimal location of incoming waste. Both examples show fill contours with a surface model colored by how much fill depth is remaining across the airspace. The only difference in the second example is the colored surface is not transparent, so you can’t see the aerial photo below the remaining airspace area. The dark green area represents at least 20’ of fill remaining, 10’-20’ is light green, 5’-10’ is yellow, 0’-5’ is orange, and red is showing where the fill is past the permitted space.
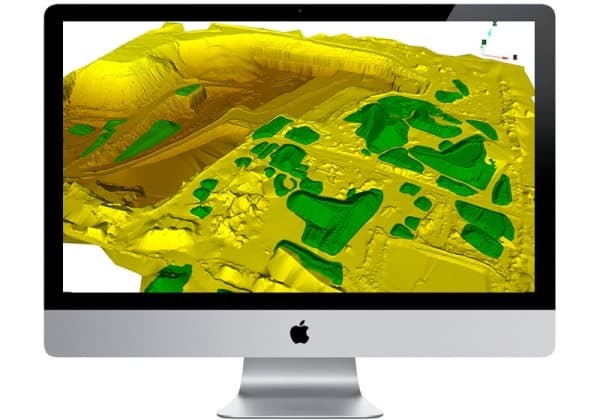
Using some of the same processes, we can also show a change detection map from our last survey to the current survey. This will show settlement or fill across the landfill. These can be useful for detecting structural stability issues if too much settlement is shown, or tracking fill in certain areas.
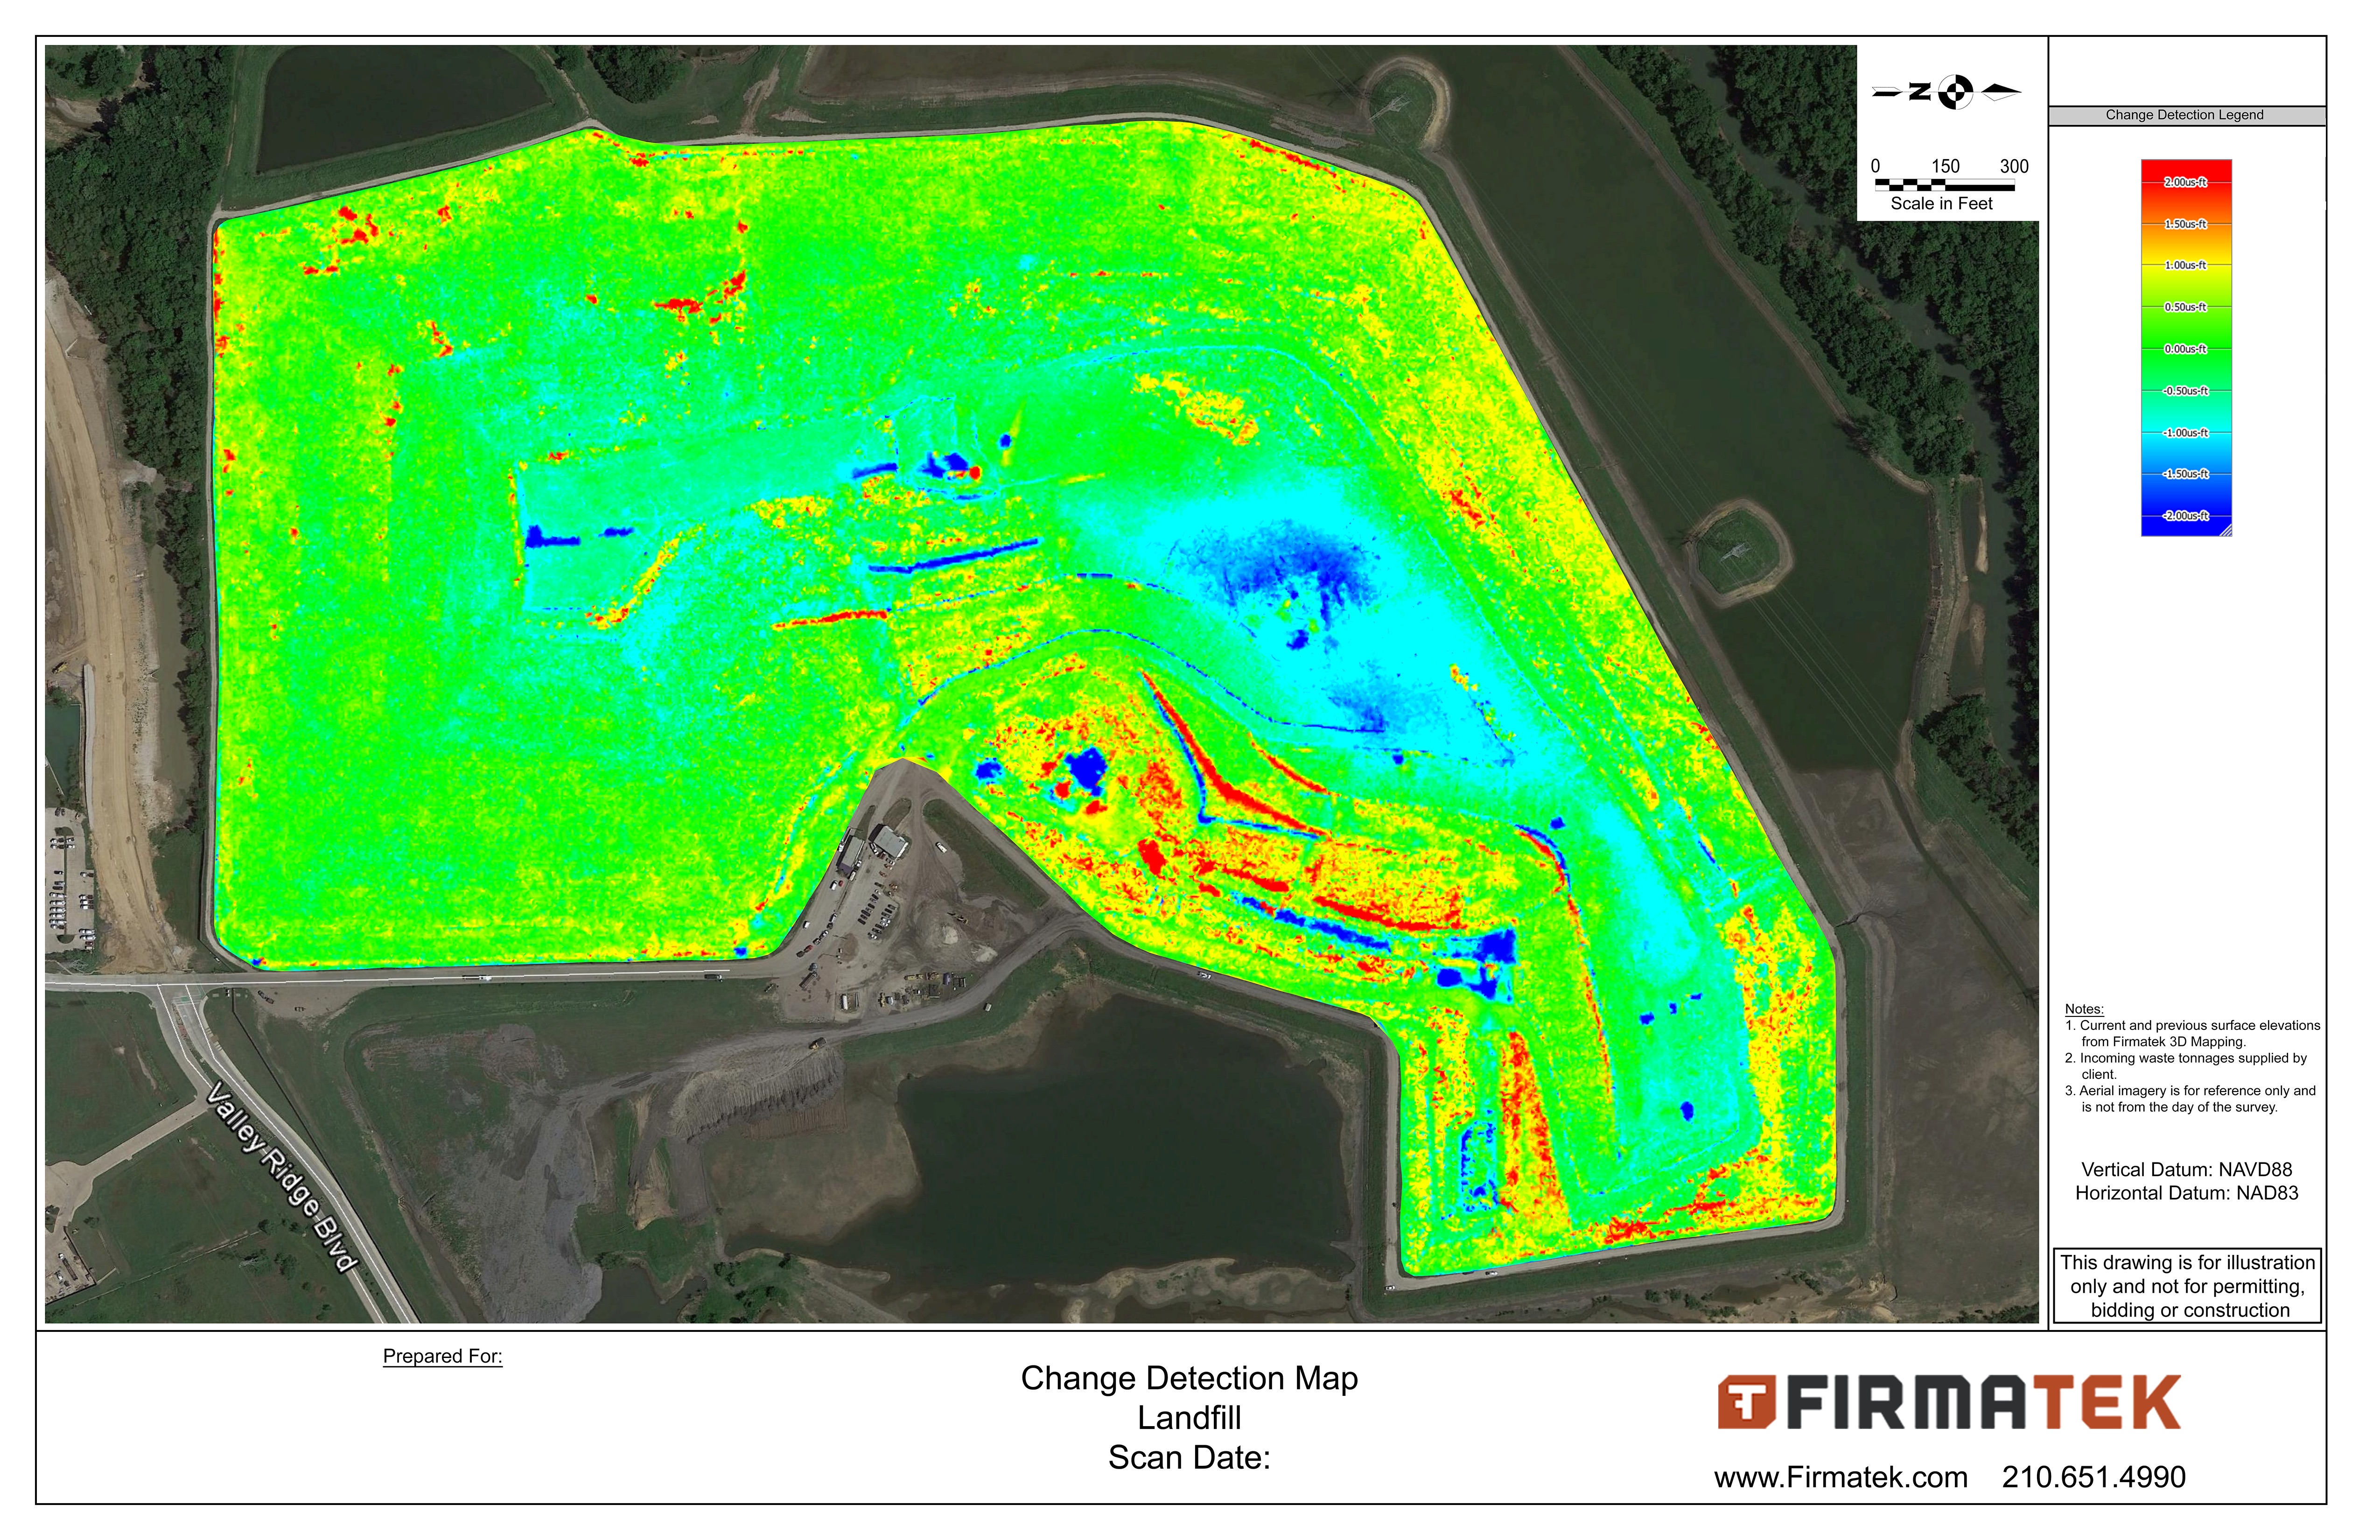
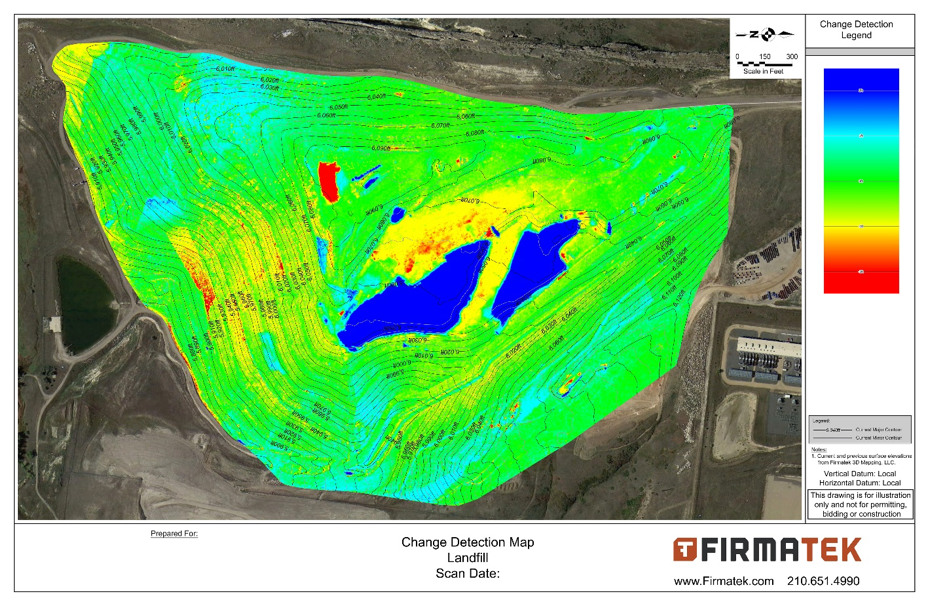
In the example above you can see the legend shows 2’ or more fill in red, areas in yellow show 1’-2’ fill, and the green represents area with less than 1’ of fill or cut. The light blue shows 1’-2’ of cut or settlement, and dark blue is 2’ or more of settlement or cut. Depending on the time between surveys you’re likely to see greater areas of change. You can clearly see the fill areas and cut areas in the map above. These maps also show data consistency, so if the data was inaccurate you would visually be able to see too much change in the overall map. Small changes can often be attributed to vegetation on the landfill.
When it comes to maximizing the capacity of a given landfill, density and air space are two of the most important metrics that managers can measure. When you make these measurements more frequently, it is easier to make adjustments over time. At Firmatek we are always looking to provide our clients with useful data solutions and can tailor any maps for our client’s specific needs. With these maps, our clients have tools to do their jobs more precisely and efficiently.
 About Seaver Hall
Seaver joined Firmatek in June of 2015. He graduated from Texas A&M University with a B.S. in Geophysics. He has been a part of the engineering team since 2016. During his time at Firmatek he has won awards for being innovative and being a trusted advisor. Seaver works with drone R&D, tailoring solutions for specific clients and developing work flows for internal purposes. He is currently studying to take the F.E. exam and shortly after obtain his P.E. license.
Other Landfill Articles:
Why You Should Manage Landfill Stockpiles with Modern Technology
3 Tips for Modernizing Your Landfill and Waste Management Plan